


Welcome to Inside Cassandra, a new series on the Apache Cassandra blog, where we interview engineers and devs in the community either about their use of Apache Cassandra to power their businesses or how they contribute to the project.
In our first interview, Patrick McFadin, Apache Cassandra community member, sat down with Marcel Birkner, Site Reliability Engineer (SRE) at Instana, an IBM Company. They discussed the unique challenge faced by the company as it strives to scale highly useful telemetry with a responsive query system. This article uses extracts from that conversation, which took place before IBM acquired the business.
One of the constants of life as an SRE is that things break all the time. If developers are expanding what the product can do, and operations are making sure everything keeps running smoothly, SREs often fill that annoying gap between theory and practice. They fix things as they break, set up alerts to enable them to know the next time it breaks, and keep a whole system humming despite its flaws.
Instana, which IBM acquired in 2020, delivers application performance management software for modern cloud-native environments and is designed to create closed-loop DevOps automation. Instana has developed a high-performance, high-scale architecture which can capture 100% of transactions in one-second intervals across an extensive distributed application in a hybrid cloud. It collects billions of metrics per day in real-time and uses Apache Cassandra to store and process the metric data at scale.
Finding the Sweet Spot for Scaling
Instana writes for some of its clusters are “250,000 to 1,200,000 metrics per second,” says Marcel, who has been an SRE at Instana for almost four years. By any standard, that’s a huge amount of data ingestion for a distributed workload. But instead of just throwing additional nodes at each problem, Marcel and his team have tried to find the scaling for each node that would perform the best. “The big challenge there is finding the right balance between resources and performance for each node. Finding the right CPU and memory size, because you neither want to have poor performance nor waste money.” That balance is critical for a team running similar demands on multiple clusters. “It took us a while to find the right sweet spot,” says Marcel.
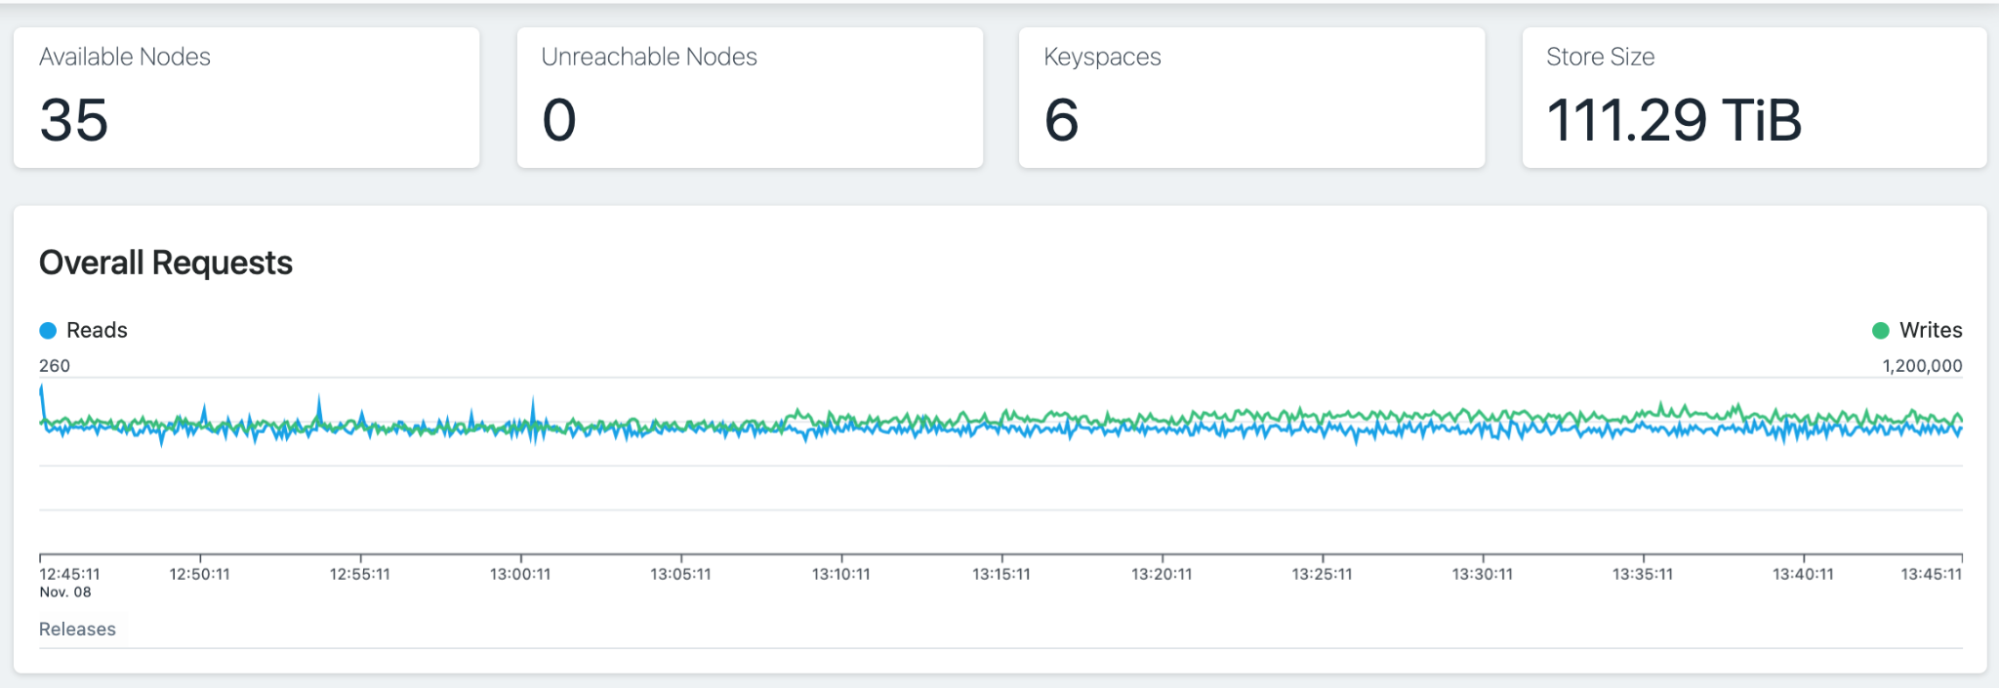
Stats for one Metrics Cassandra cluster: 380k writes/sec, 9k reads/sec, overall great latency.
The challenge of knowing when to scale horizontally, when to scale vertically, and when to scale down to save money is something every operations or reliability engineer has faced in the real world. “There’s no single answer for all use cases,” says Marcel, but he sees close monitoring of your system as part of the solution: If you don’t know the effect that resource allocation is having on your service, there’s no way to optimize.
Monitoring a Monitoring Service
In many ways, monitoring, or its buzzword cousin observability, is the lifeblood of any SRE’s work. At a company whose product is monitoring, the act of monitoring your own services is ‘dog-fooding’ at its finest.
“We are a monitoring company, and we monitor the things that we use ourselves the best,” says Marcel. And really, it makes sense: any time a monitoring company is surprised by resource overruns or over-provisioning that has budgetary impacts, the jokes kind of write themselves.
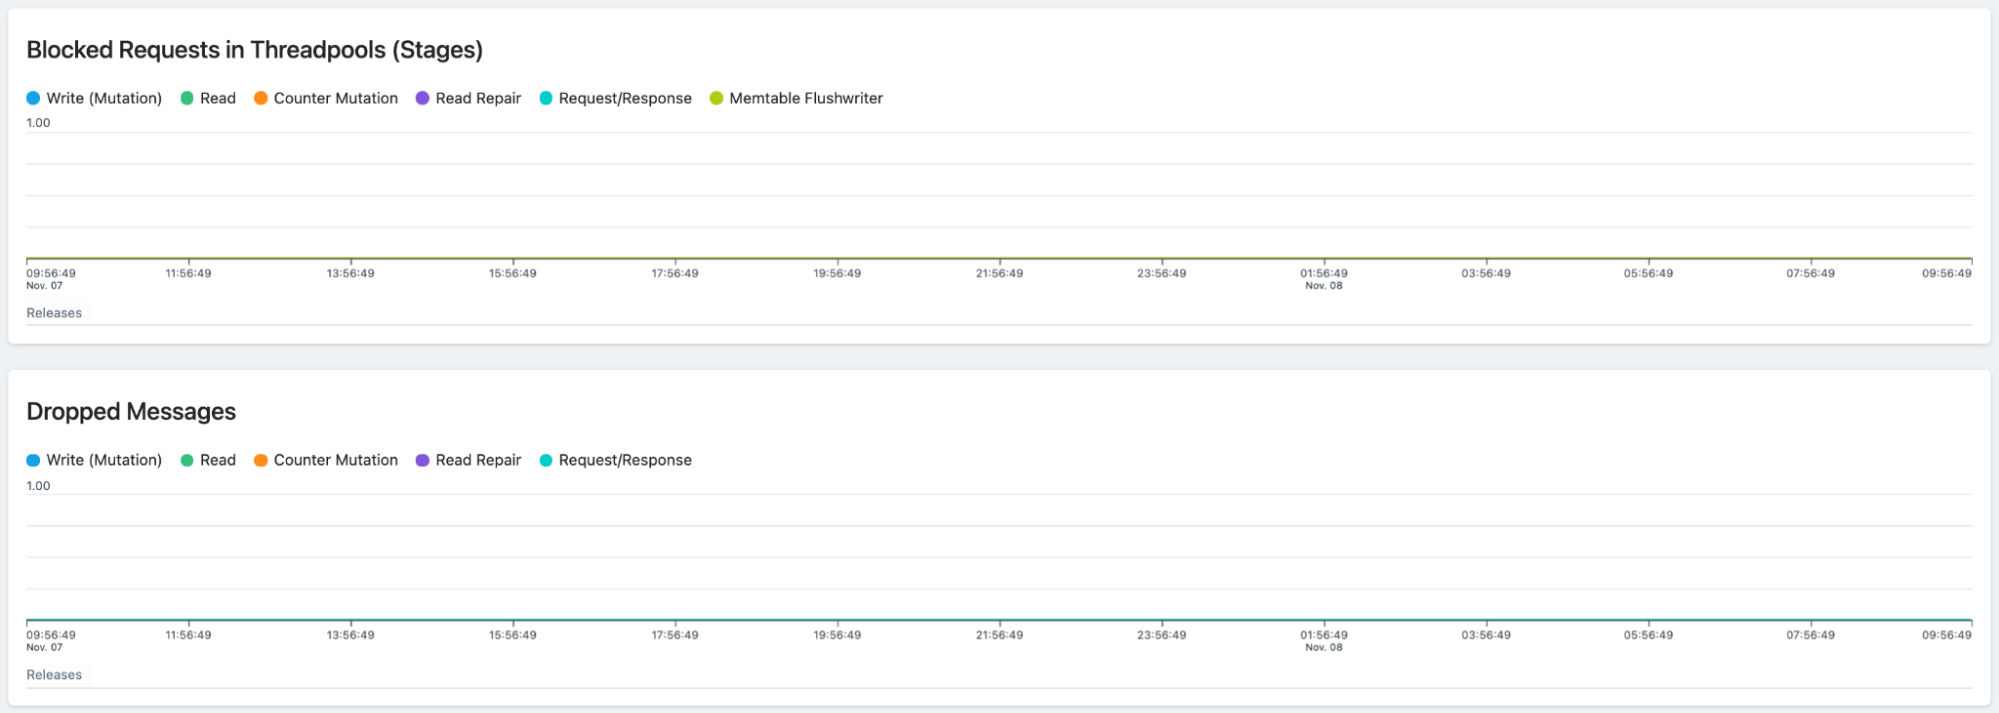
Marcel monitors a stack where most components are running as part of a cluster, and, as such, there is fault-tolerance built-in thanks, in part, to Cassandra: “a single failing node does not impact our customers. Our system is built to handle these kinds of things. Nevertheless, it is critical to resolve these problems so that they do not escalate.”
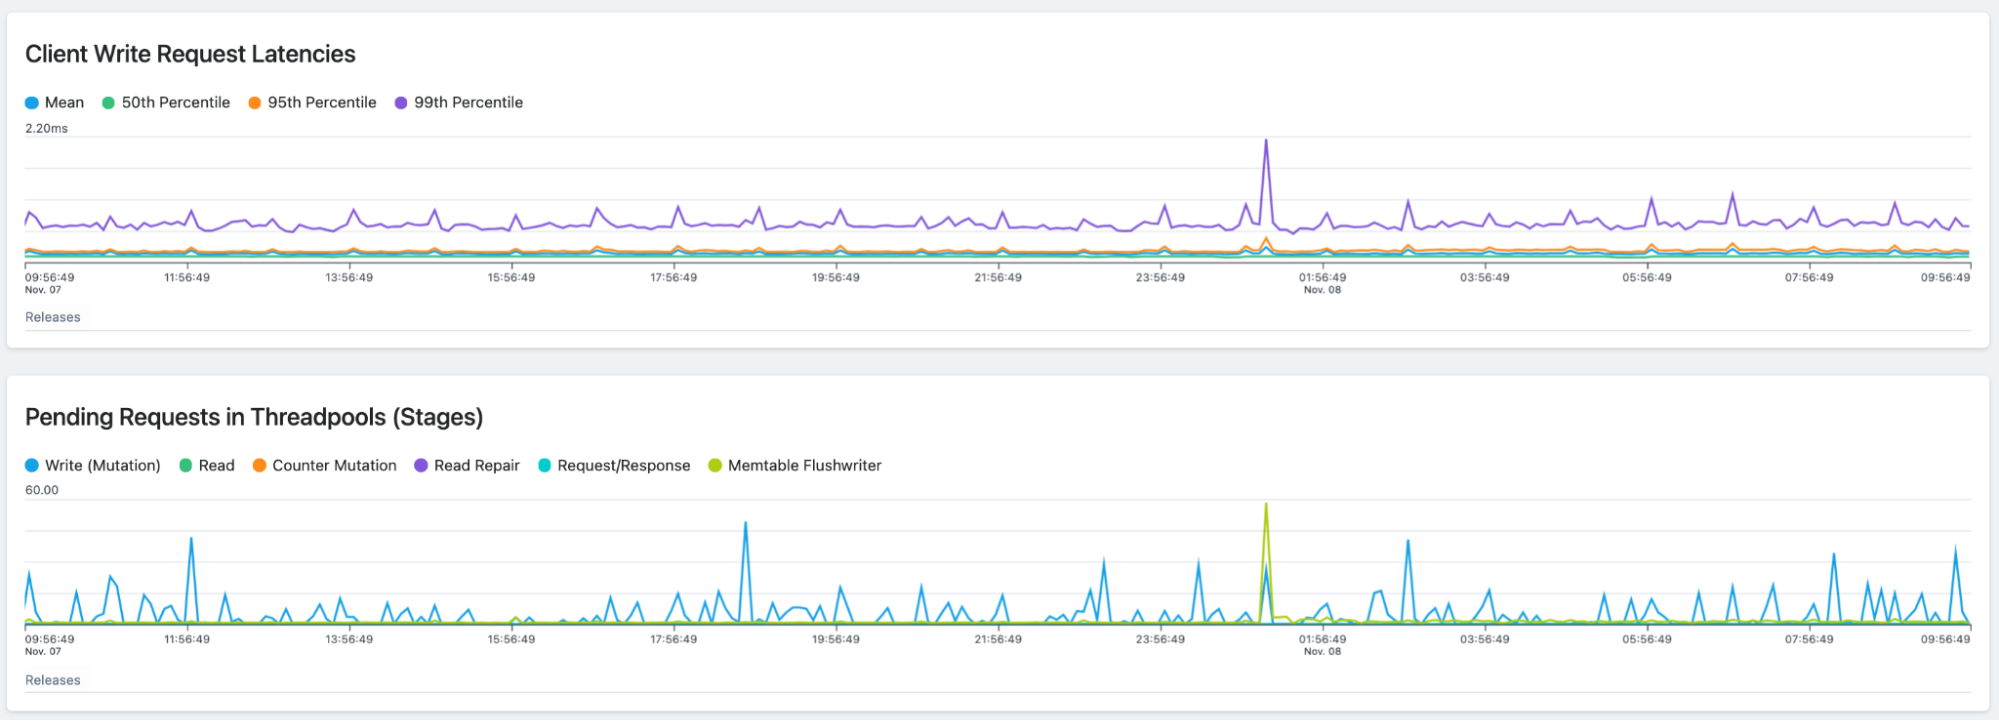
When you begin on your journey to a well-monitored system, the first step is always the monitoring and alerts that come built-in. For Marcel and the team, Cassandra’s built-in tools were part of the picture from the outset. “Since we use Apache Cassandra heavily ourselves, there’s a lot of built-in alerts,” he told Patrick. A variety of metrics are crucial to understanding service health, such as: “the queuing mutation requests or whether there’s high CPU load now on nodes, or if there are network problems.” Together these give insight into critical questions like the node scaling mentioned above.
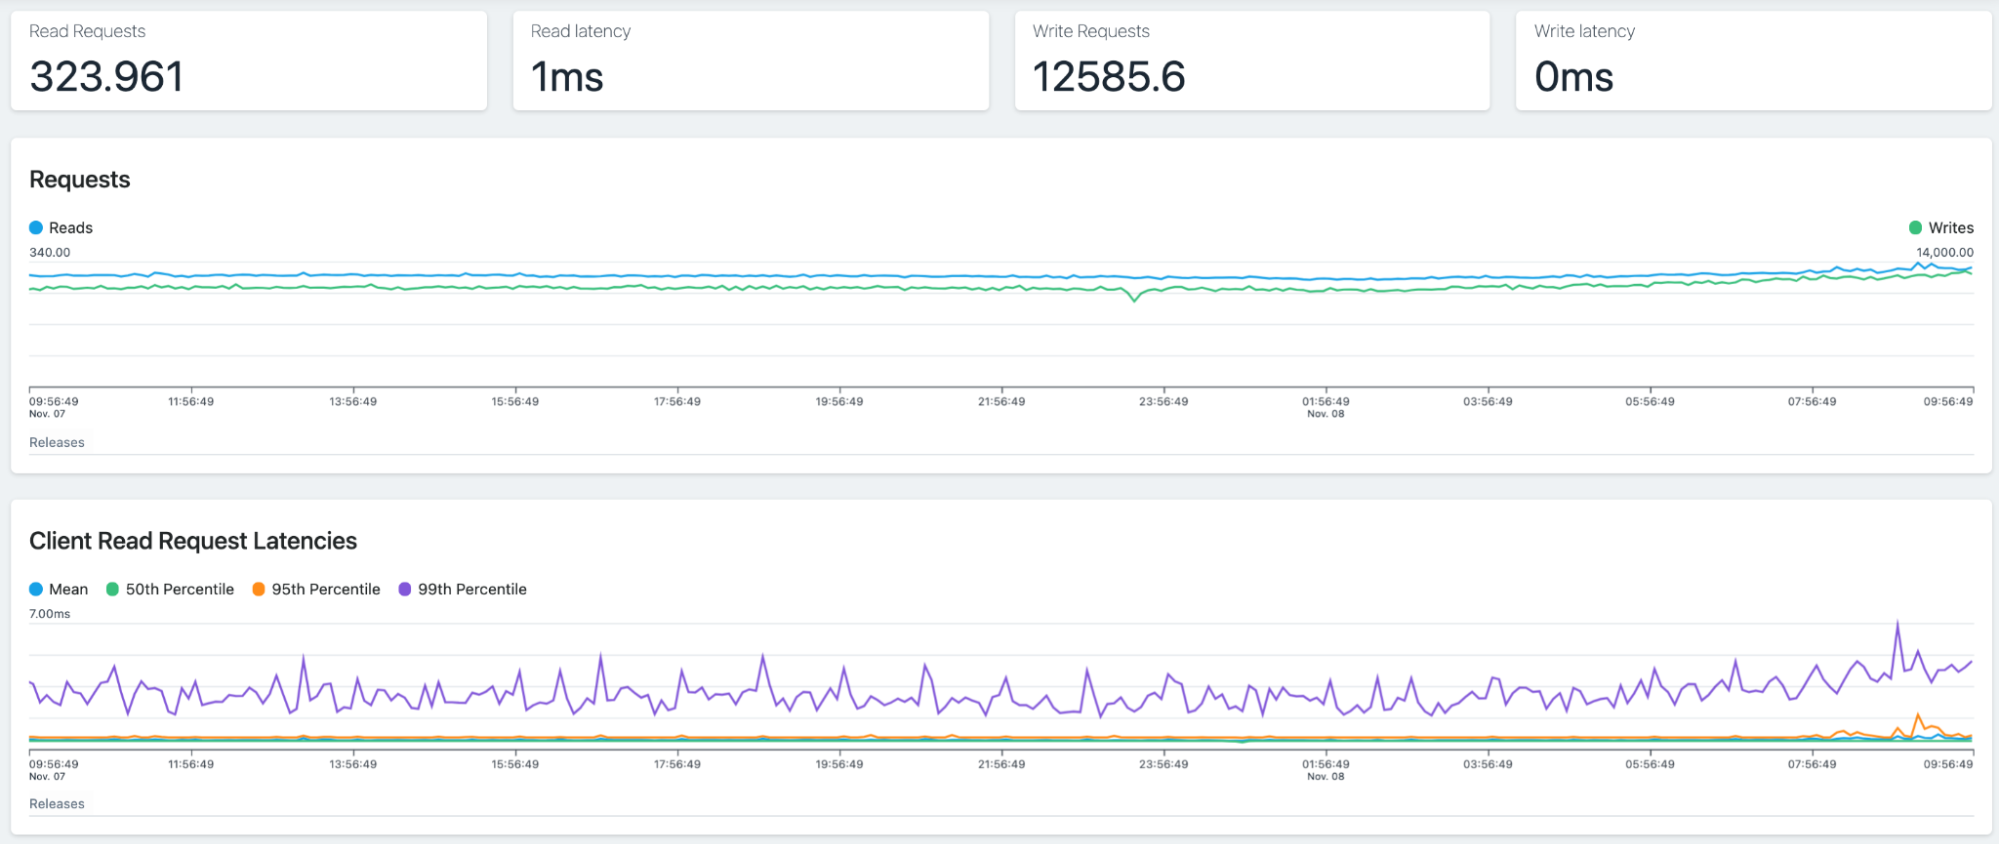
Detailed statistics for a single metrics Cassandra node.
When scaling, experimentation is vital. Monitoring is a crucial component here since operators need to answer whether modifying provisioning helped at all. “We’re able to monitor very closely what’s happening on the host while we tweak everything, and that lets us compare before and after the tweaks,” says Marcel.
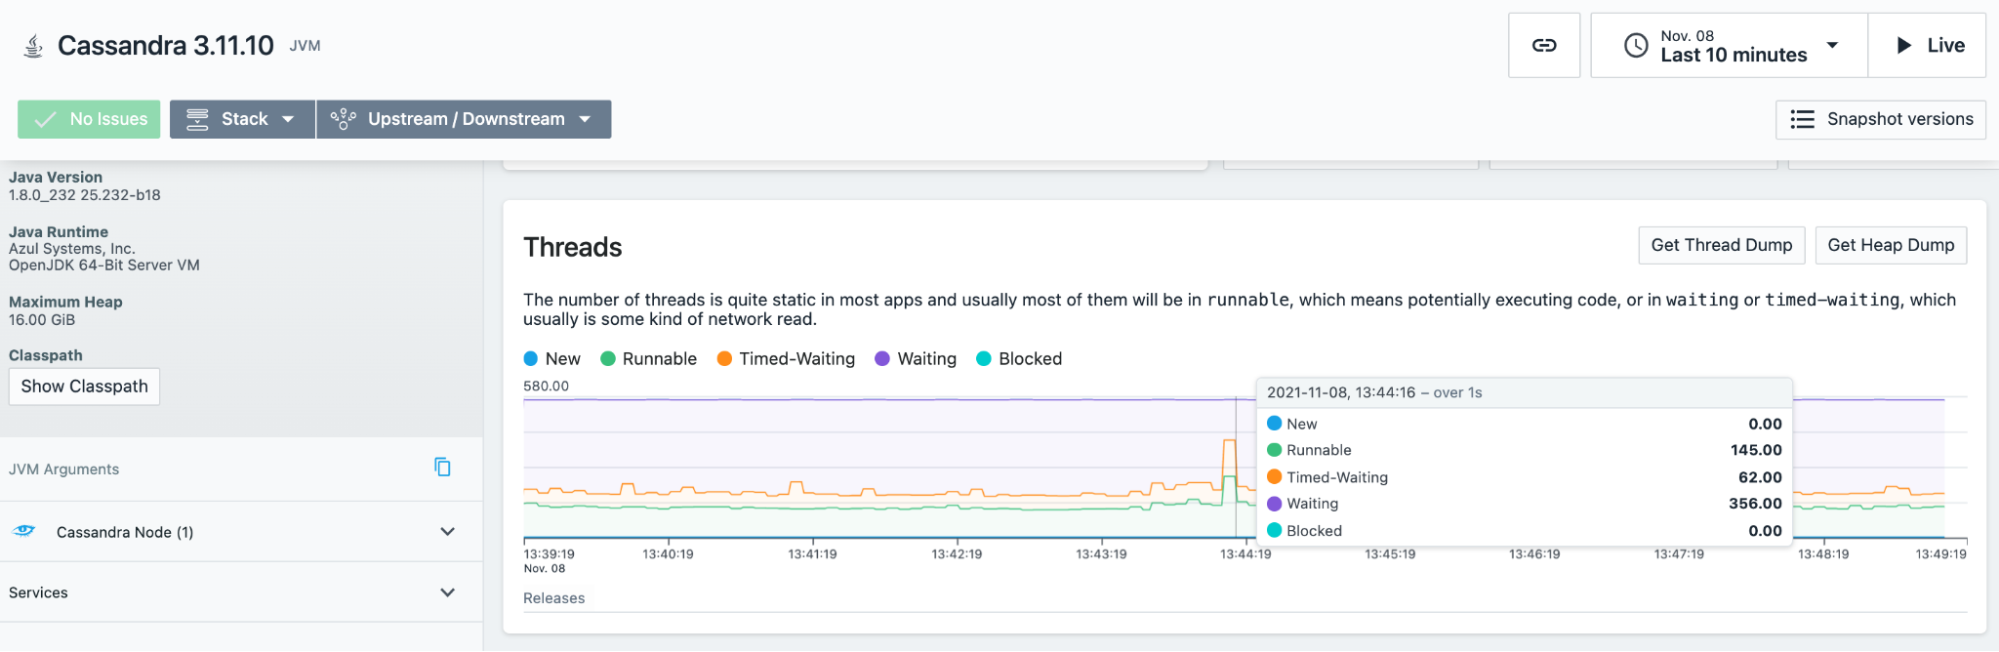
1-second metrics resolution helps us identify even small spikes in metrics when making infrastructure changes.
Using Monitoring needs to Grow the Product
The most important benefit of ‘dog-fooding,’ or using your own product the way your customers do, is the way it highlights how the service needs to expand. For Marcel, that meant finding additional monitoring needs. “So the thing is, we monitor all aspects like network disk I/O on the host JVM […] if we are missing metrics, we just write the sensor for it, to get additional metrics.”
“If we have problems as an SRE team, and we don’t have the insights, we just tell our engineering team,” says Marcel. “Then they just enhance the product, either by new data routes or by new data that they’re collecting from the different technologies we monitor. And that makes our lives a lot easier.”
Head here for more information on monitoring and metrics within Apache Cassandra, and for a list of third-party projects, tools, and products, head to the project’s Ecosystem page.